Why Build Dashboards with AI?
Most dashboard tools require you to learn a platform, connect data sources, configure widgets, and then figure out how to share what you made. That process can take hours for something you just need to send by end of day.
Claude skips all of that. You describe the dashboard you want in plain English, paste in your data, and get a complete HTML dashboard with charts, KPI cards, and responsive layout. The whole thing takes minutes.
The real advantage, though, is sharing. Once Claude creates your dashboard, the /share command publishes it to a unique URL at sharable.link. Anyone with the link can open it in their browser — no login, no software, no friction.
This is how dashboards should work when you need speed over infrastructure.
What Makes Claude Dashboards Different
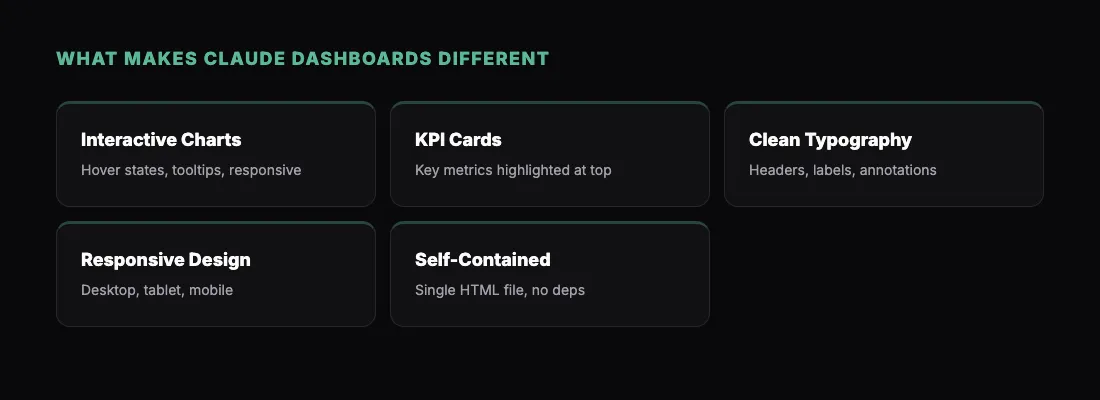
Claude does not just drop numbers into a template. It reads your data, picks the right visualization types, and creates a cohesive layout that tells a story. You get:
- Interactive charts — hover states, tooltips, and responsive sizing
- KPI cards — key metrics pulled out and highlighted at the top
- Clean typography — section headers, labels, and annotations that make the data readable
- Responsive design — the dashboard works on desktop, tablet, and mobile
All of this lives in a single HTML file. No dependencies, no build step, no server required. That is what makes it easy to share — it is completely self-contained.
Three Dashboard Prompts You Can Try Right Now
Here are three prompts that produce genuinely useful dashboards. Copy them directly into Claude, swap in your own data, and you will have a working dashboard in minutes.
1. Weekly Team Metrics Dashboard
"Build an interactive HTML dashboard showing weekly team performance metrics. Include these sections: a row of KPI cards for total revenue ($142K), new customers (38), churn rate (2.1%), and NPS score (72). Below that, add a line chart showing revenue trend over the past 12 weeks, a bar chart comparing new vs. churned customers by week, and a table with per-team-member performance. Use a clean dark sidebar layout with a white content area. Make the charts interactive with hover tooltips."
This prompt works well for Monday morning standups. You paste in your numbers each week, Claude rebuilds the dashboard, and you /share the updated version. Your team gets a fresh link every Monday.
2. SaaS Product Analytics Dashboard
"Create a product analytics dashboard for a SaaS app. Include: daily active users (DAU) over the last 30 days as an area chart, a funnel visualization showing signup > onboarding > activation > paid conversion with these rates: 100% > 64% > 41% > 12%, a cohort retention heatmap for the last 8 weekly cohorts, and a feature adoption table ranking the top 10 features by usage percentage. Use a modern design with a blue and gray color scheme. Add filter tabs at the top for 7d / 30d / 90d views."
Product dashboards like this are perfect for board updates, investor meetings, or internal reviews. The cohort heatmap alone would take an hour to set up in most BI tools. Claude builds it in seconds.
3. Marketing Campaign Performance Dashboard
"Build a marketing campaign dashboard with the following data and charts: a summary row showing total spend ($24,500), impressions (1.2M), clicks (18,400), conversions (892), and CPA ($27.47). Add a stacked bar chart showing spend by channel (Google Ads, Meta, LinkedIn, Email) over the last 4 weeks. Include a scatter plot showing CPA vs. conversion volume by campaign. Add a sortable table listing all campaigns with spend, impressions, CTR, conversions, and ROAS columns. Use green for positive ROAS and red for negative. Professional white layout with subtle grid lines."
Marketing teams burn hours building these in spreadsheets every week. With Claude, you paste in the export from your ad platforms and get a polished dashboard that actually looks good enough to send to leadership.
How to Share Your Dashboard
Once Claude creates your dashboard, sharing it takes one step. If you have the sharable.link skill installed, just type:
"/share"
Claude reads the HTML file, uploads it, and returns a URL like sharable.link/a1b2c3d4. Send that link to anyone. They open it in their browser and see the full interactive dashboard.
If your dashboard contains sensitive data — revenue numbers, customer counts, internal metrics — you can add password protection:
"Share this with a password"
Claude will ask you to set a password. The recipient sees a clean unlock screen before the dashboard loads. No accounts, no signups, just the password and the data.
For a more detailed walkthrough, check out How to Share a Claude Dashboard with Anyone in 30 Seconds.
Tips for Better Dashboards
Be specific about layout. Claude responds well to layout instructions like "KPI cards in a row at the top" or "two charts side by side." The more spatial detail you give, the more polished the result.
Include real numbers. Even if you are prototyping, paste in actual data or realistic sample data. Claude will choose better chart types and scales when it has real numbers to work with.
Iterate before sharing. Ask Claude to adjust colors, add sections, or change chart types. Each change takes seconds. Get it right, then share.
Name your metrics clearly. Instead of "show metric A," say "show Monthly Recurring Revenue (MRR)." Claude uses your labels directly in the dashboard, so clear names mean a cleaner result.
Ask for interactivity. Claude can add hover tooltips, sortable tables, and filter controls. You just have to ask. The defaults are good, but specifying interactive elements makes the dashboard significantly more useful.
What Else Can You Build?
Dashboards are one of the strongest use cases for Claude's HTML output, but they are far from the only thing worth building. Claude handles a wide range of artifacts — from reports to landing pages to interactive tools.
If you are curious about what is possible, take a look at 5 Things You Can Build with Claude and Share Instantly for more ideas.
Get Started
- Install the sharable.link skill
- Open Claude and paste one of the dashboard prompts above
- Review the output, iterate if needed
- Type
/shareto publish it - Send the link to your team
The whole process takes less than five minutes. No dashboard platform to learn, no deployment to manage, no accounts for your recipients to create. Just a prompt, a dashboard, and a link.