The Report Is Done. Now What?
You gave Claude a prompt like "Create a quarterly performance report with revenue trends, customer acquisition metrics, and a strategic recommendations section." Claude delivered. The report looks sharp — clean typography, data tables, charts, executive summary at the top.
Now you need your team to see it.
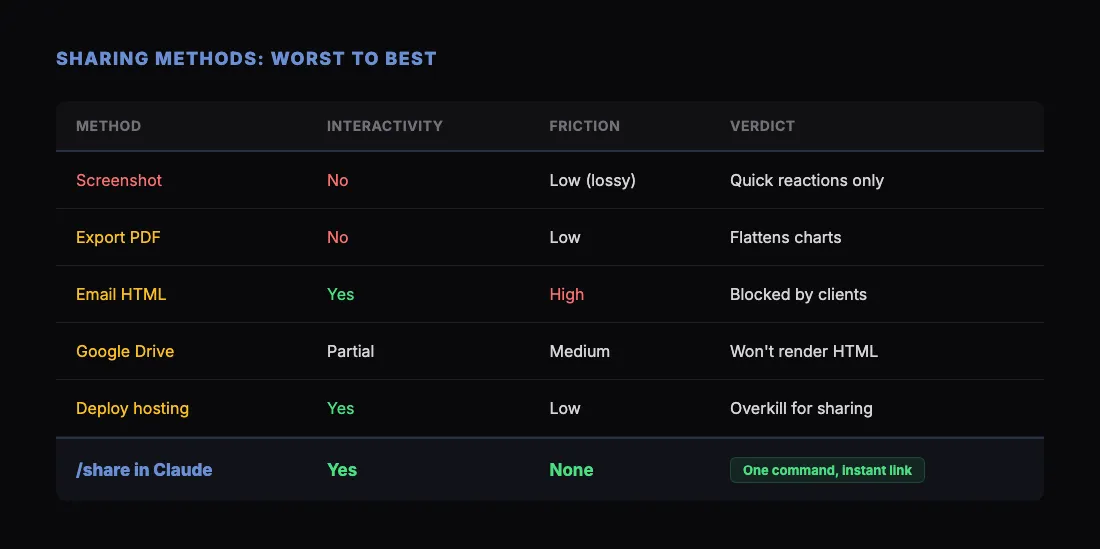
This is where most people hit friction. The report exists as an HTML file or an artifact in your Claude conversation. Getting it from there to your team's eyeballs involves more steps than it should. Let's walk through every option, from worst to best.
Option 1: Screenshot and Paste
The quickest instinct is to take a screenshot and drop it into Slack or email.
Why people do it: It takes five seconds. No files to attach, no links to generate.
Why it's bad: Screenshots strip out everything that makes an AI-generated report useful. Your team can't click through sections, interact with charts, copy data from tables, or read text that extends below the fold. A 2,000-word report with interactive charts becomes a static image that's hard to read on a phone.
Screenshots are fine for quick reactions in chat. They're not a sharing method for real reports.
Option 2: Export as PDF
You could print the HTML to PDF (Cmd+P / Ctrl+P in the browser, then "Save as PDF") and email it or upload it to Google Drive.
Why people do it: PDFs feel official. They're a familiar format for reports. Everyone can open them.
Why it's bad for AI reports specifically: Claude's reports are designed as HTML. They often include interactive elements — collapsible sections, hover-state charts, responsive tables that scroll horizontally. PDF flattens all of this. Charts become static images. Tables might overflow the page. Responsive layouts break because PDF enforces a fixed page width.
You also lose the visual design. Claude's HTML reports use web-native styling — CSS that looks great on screens but translates poorly to the rigid page model of PDF.
PDF makes sense for final, formal documents. For AI-generated reports that your team needs to review, iterate on, and discuss, it strips away too much.
Option 3: Email the HTML File
You could save the HTML file and send it as an email attachment.
Why people do it: It preserves everything — all the interactivity, all the styling.
Why it fails in practice: Most people won't open an HTML attachment from their email. Gmail shows a warning. Outlook blocks it by default. The recipient has to download it, find it in their Downloads folder, and open it in a browser. That's three steps before they even see your report.
In a corporate environment with security policies, HTML attachments may be blocked entirely. Even if they get through, the friction guarantees that half your team never opens it.
Option 4: Upload to Google Drive or Dropbox
Save the HTML file and put it in a shared Drive folder or Dropbox link.
Why people do it: The team already uses these tools. Sharing is familiar.
Why it's clunky: Google Drive doesn't render HTML files. It shows a download prompt. The recipient has to download the file and open it locally — the same problem as email attachments, just with a different download source.
Dropbox has a preview for HTML files, but it's inconsistent. Some scripts don't execute. Some styles don't render. The preview is not the same as opening the file in a real browser.
Option 5: Deploy to a Hosting Platform
You could push the HTML to Netlify, Vercel, or GitHub Pages and share the URL.
Why it works: The recipient gets a real web page. Everything renders correctly. They click a link and see the report.
Why it's overkill: Deploying a report to a hosting platform means creating an account (if you don't have one), setting up a project, uploading files, and waiting for a build. For a report you need to share in the next five minutes, this is too much infrastructure.
See our full comparison of free HTML hosting options for details on each platform.
Option 6: Use /share in Claude
The fastest path from "report is done" to "team has the link" is the /share command.
Here's the workflow:
- Generate the report. Ask Claude to build it with whatever structure and data you need:
> "Create a monthly marketing performance report. Include sections for traffic overview, conversion funnel metrics, channel breakdown, and top-performing content. Use sample data for March 2026."
- Review it. Check the output in Claude's preview. Ask for changes: "Make the executive summary more concise" or "Add a comparison column showing month-over-month change."
- Type
/share. Claude publishes the HTML to sharable.link and returns a URL likesharable.link/a1b2c3d4.
- Send the link. Paste it into Slack, email, Notion, a project management tool — anywhere you communicate with your team.
The recipient clicks the link and sees the full report. Charts are interactive. Tables are scrollable. The layout is responsive on desktop and mobile. No downloads, no file management, no accounts.
Adding Password Protection
If the report contains sensitive data — revenue numbers, customer details, internal metrics — add a password. Say "share this with a password" when you run /share. Claude will ask you to set one.
Send the link to your team along with the password. They enter it once and see the report. Simple access control without enterprise SSO complexity.
Making Better Reports to Share
The quality of the shared report depends on what you ask Claude to build. Here are prompts that produce reports worth sharing:
Financial report:
"Create a Q1 financial summary report with revenue breakdown by product line, expense categories, gross margin trends, and a cash flow overview. Include data tables and charts. Use sample data."
Project status report:
"Build a project status report for a mobile app development project. Include milestone timeline, task completion rates by sprint, risk register with severity ratings, and a resource allocation summary."
Market research report:
"Generate a competitive landscape report for the project management SaaS market. Include a market size overview, feature comparison matrix of the top 5 tools, pricing comparison table, and strategic positioning map."
Client-ready report:
"Create a monthly SEO performance report for a client. Include organic traffic trends, keyword ranking changes, top landing pages, backlink growth, and recommended next steps. Brand it with a professional layout."
Each of these produces a polished, multi-section HTML report that looks professional when shared via link. For a deeper dive into Claude's reporting workflow, see how to use Claude for client reports.
The Team Review Workflow
Once you have a shareable link, here's how to run an effective team review:
- Share the link with context. Don't just paste a URL. Add a message: "Here's the Q1 report draft. I'd like feedback on the revenue projections in Section 3 and whether the strategic recommendations align with our priorities."
- Collect feedback. Let team members view the report and respond in your team chat or comments.
- Iterate with Claude. Take the feedback back to Claude: "Update the report — change the Q2 projection from 15% to 12% growth, and add a section on competitive threats." Claude updates the HTML.
- Share again. Run
/shareagain to publish the updated version. You get a new URL with the latest content.
This loop — generate, share, collect feedback, update, share again — takes minutes instead of the hours it takes with traditional document workflows.
Why Links Beat Files
Sending a link instead of a file fundamentally changes the sharing experience:
- No download required. The recipient clicks and sees. Zero friction.
- Consistent rendering. Everyone sees the same thing, regardless of their device or email client.
- Interactive elements work. Charts, filters, collapsible sections, hover states — all preserved.
- Mobile friendly. Claude's HTML is responsive. Reports look good on phones without pinch-zooming a PDF.
- Easy to forward. A link can be shared again by anyone who has it. No attachment size limits.
Get Started
Stop screenshotting your AI reports. Start sharing them as live, interactive pages.
- Download SKILL.md from sharable.link.
- In Claude: Customize → Skills → + → Create skill → Upload a skill.
- Generate your next report with Claude.
- Type
/shareand send the link to your team.
For more on how to build effective dashboards, see our guide on sharing Claude dashboards. Or explore how to host HTML files online for free if you need a permanent hosting solution.