More Than Code Snippets
When most people think of Claude artifacts, they think of code blocks and simple previews. That undersells what artifacts actually are. Claude can generate complete, interactive HTML applications — styled, functional, and self-contained in a single file.
The range of what you can build is wider than you might expect. Dashboards, yes. But also games, design tools, data visualizations, educational simulations, and full multi-screen applications. Each one lives as an HTML file that runs in any browser.
And with the /share command from sharable.link, anything Claude builds can become a live URL in seconds. Build it, share it, and anyone with the link can use it.
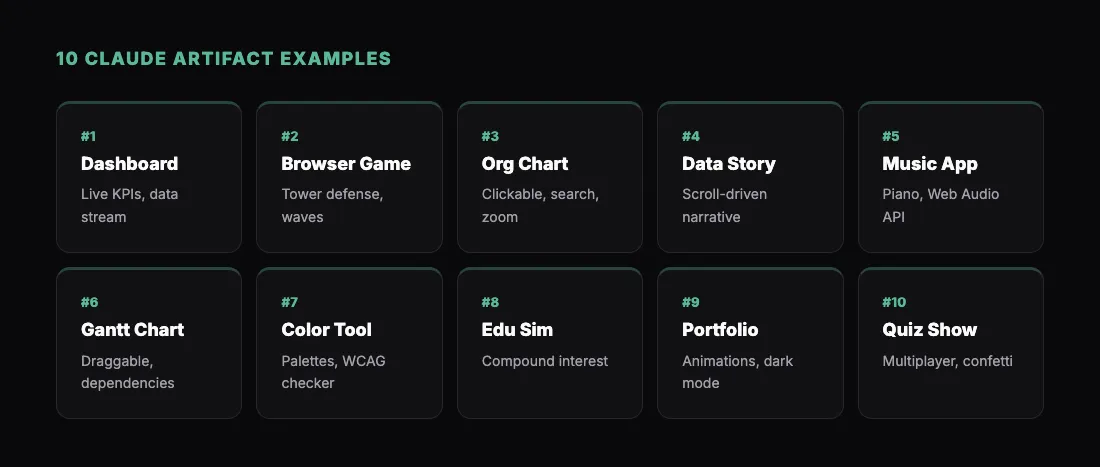
Here are 10 examples that demonstrate what Claude artifacts are really capable of. Each one includes a prompt you can copy directly into Claude.
1. Real-Time Data Dashboard
Dashboards are one of Claude's strongest outputs. But you can push beyond basic charts into something genuinely interactive.
"Build a real-time monitoring dashboard for a web application. Include: a live-updating header showing current time, a row of KPI cards for active users (2,847), requests per second (1,203), error rate (0.3%), and average response time (142ms). Add a line chart that simulates real-time data by appending a new data point every 2 seconds. Include a server status grid showing 8 servers with green/yellow/red indicators. Add a log feed at the bottom showing simulated log entries scrolling in. Dark theme with green accent colors like a monitoring terminal."
The simulated real-time updates make this feel like a production monitoring tool. It is a great prototype for showing stakeholders what a monitoring system could look like.
For a deeper dive into dashboards, see Build and Share an AI Dashboard with Claude in Minutes.
2. Playable Browser Game
Claude can build surprisingly complete games. Not just toy demos — actual playable experiences with scoring, levels, and polished visuals.
"Build a tower defense game in HTML. The player places defense towers on a grid map. Enemies spawn from the left and walk along a path toward the right side. Towers automatically shoot at enemies in range. Include 3 tower types: basic (cheap, low damage, fast fire rate), cannon (expensive, high damage, slow), and freeze (slows enemies, no damage). Add a currency system — the player earns gold for each enemy defeated and spends it on towers. Include a wave counter, health bar for the base, and a score display. Enemies should get stronger each wave. Use a clean pixel-art style with a green grass background."
This is a fully functional game that runs in the browser. Share the link and people can play it on their phone during lunch.
3. Interactive Organizational Chart
Org charts are one of those things that should be easy but never are. Presentation tools make them static. Specialized software costs too much for what it does. Claude builds interactive ones.
"Build an interactive organizational chart. Start with a CEO at the top, three VPs below (Engineering, Product, Sales), and 2-3 direct reports under each VP. Make the nodes clickable — clicking a node expands or collapses their direct reports. Each node should show the person's name, title, and department in a small card. Add a search box at the top that highlights matching nodes. Include a zoom in/out control. Use a clean corporate design with subtle shadows and connection lines."
The expand/collapse and search features make this genuinely useful, not just a visual. Share it during onboarding or team meetings.
4. Data Visualization Story
Beyond charts, Claude can build narrative data visualizations — the kind you see in data journalism.
"Create a scrolling data visualization story about global internet adoption from 2000 to 2025. As the user scrolls, show: a world map that gradually colors in as countries gain internet access, a counter showing total global internet users animating up from 400M to 5.5B, charts showing adoption rate by continent, a section on the mobile internet revolution with a phone vs. desktop usage crossover chart, and a final section on the digital divide with a comparison between the 5 most and 5 least connected countries. Each section should animate into view on scroll. Clean, editorial design inspired by data journalism sites."
This type of artifact demonstrates that Claude can handle complex, multi-section interactive content — not just standalone widgets.
5. Music Instrument Simulator
Claude handles Web Audio API surprisingly well, which means you can build functional musical instruments.
"Build a playable piano keyboard in HTML. Include 2 octaves (C4 to B5) with both white and black keys. Keys should play the correct note when clicked using the Web Audio API. Also map computer keyboard keys (A-L row for white keys, W-E-T-Y-U for black keys) so users can play with their keyboard. Show the note name when a key is pressed. Add a sustain toggle button. Include a simple record/playback feature — the user can record a short melody and play it back. Clean design with realistic key styling and subtle shadows."
A working piano in the browser, built from a single prompt. Share it with a musician friend and watch their reaction.
6. Project Timeline and Gantt Chart
Gantt charts are notoriously painful to build. Claude makes them interactive and good-looking.
"Build an interactive Gantt chart project timeline. Include 4 project phases (Discovery, Design, Development, Launch) with 3-4 tasks under each phase. Tasks should have start dates, end dates, and progress percentages. Display them as horizontal bars on a timeline with month columns. Color-code by phase. Show dependencies as arrows between tasks. Make tasks draggable to adjust their timeline. Add a 'Today' line showing the current date. Include a progress summary at the top showing overall project completion. Clean, professional design with a white background and subtle grid."
The draggable tasks and dependency arrows make this a legitimate project planning tool. Share it with your PM team as a prototype.
7. Color Palette Generator and Design Tool
Design tools are a strong use case because Claude understands color theory and can implement the math behind palette generation.
"Build a color palette generator tool. Start with a base color input (hex or color picker). Generate palettes using 5 different methods: complementary, analogous, triadic, split-complementary, and monochromatic. Display each palette as a row of color swatches with hex codes. Click any swatch to copy its hex value. Add a preview section showing the selected palette applied to a sample UI mockup (a card with heading, text, button, and background). Include an accessibility checker that shows contrast ratios between foreground and background combinations, with WCAG AA/AAA pass/fail badges. Dark UI with the palettes as the visual focus."
This is a tool designers will actually bookmark. The WCAG contrast checker alone makes it useful for daily work.
8. Interactive Educational Simulation
Claude can build simulations that teach concepts through interaction — far more engaging than reading about them.
"Build an interactive simulation of how compound interest works. Include inputs for: initial investment, monthly contribution, annual interest rate, and time period in years. Show an animated chart that grows over time — the user can watch their investment compound year by year. Split the chart into two colors showing contributed amount vs. interest earned. Add milestone markers (e.g., 'Your interest exceeds your contributions at year 12'). Include a comparison mode: show two investment scenarios side by side with different parameters. Add a table showing year-by-year breakdown of contributions, interest, and total. Modern, clean design with smooth animations."
Educational simulations like this are perfect for financial literacy content, classroom resources, or content marketing in fintech.
9. Interactive Resume or Portfolio
Claude can build personal websites and portfolios that go beyond static pages.
"Build an interactive developer portfolio as a single HTML page. Include: a hero section with name, title, and animated typing effect for skills, a project showcase section with 4 project cards that flip on hover to show details, a skills section with animated progress bars, a timeline showing work history, a testimonials carousel, and a contact form. Add smooth scroll navigation, a dark/light mode toggle, and subtle particle animation in the hero background. Use a modern, minimal design with a purple accent color. Make it fully responsive."
Anyone can create a portfolio site this way without touching a website builder. Share the link on LinkedIn or in job applications.
10. Multi-Player Quiz Show
Push Claude's limits with a more complex interactive application that handles state management and game mechanics.
"Build a quiz show game for 1-4 players on the same screen. Setup screen lets players enter their names and choose an avatar (emoji). Game has 10 general knowledge questions. Each round: show the question and 4 answer options. Each player has their own colored buzzer button on screen. First to buzz in gets to answer. Correct answer earns 100 points, wrong answer loses 50. Show a leaderboard after each question with animated score updates. After 10 questions, show a winner celebration screen with confetti animation. Use a game-show visual theme with bright colors and dramatic fonts."
This is a party game built from a single prompt. Share the link before a team gathering and you have instant entertainment.
What Ties These Together
Every example above is a single HTML file. No backend, no database, no npm install. Claude generates the complete application — HTML structure, CSS styling, and JavaScript logic — in one artifact.
That self-contained nature is what makes the /share workflow so powerful. Build any of these, type /share, and you have a live URL in seconds. Anyone with the link can use the tool, play the game, or explore the visualization.
To understand more about how Claude artifacts work under the hood, check out Claude Artifacts: What They Are and How They Work.
Get Started
- Install the sharable.link skill
- Copy any prompt from this list into Claude
- Watch Claude build the artifact
- Test it, iterate if you want to customize it
- Type
/shareto publish - Send the link to someone who will appreciate it
The ten examples here are just starting points. Once you see what Claude can build, you will start thinking of your own ideas — tools specific to your industry, visualizations for your data, games you have always wanted to try. The barrier between idea and working prototype has never been lower.